

Seattle has issued 183 permits for deck work on houses so far in 2026, through October 26, 2026. That is already more than in all of 2025 (182), with two months left in the year, and 15% more than at the same point of 2025 (159). It is the most by late October since 2022.
We pulled every permit in the City of Seattle’s building permit records whose description names a deck, kept the ones for single-family homes and duplexes, and placed each one on the City’s own neighborhood map. The result covers 2,688 deck permits issued from January 2016 to October 26, 2026: where Seattle builds decks, how long a deck permit takes, what owners declare the work is worth and the months they apply. How we counted is at the end of the page, and anyone can use these numbers with a link to this page.
- 183 deck permits issued in 2026 through October 26, 2026, up 15% from 159 at the same point of 2025. Applications are up 12%.
- Wallingford has the most deck permits of any Seattle neighborhood: 95 since 2016, ahead of North Admiral (Admiral) and Ravenna with 79 each.
- By district, West Seattle leads with 379 deck permits since 2016.
- A permit for a deck alone took a median of 37 days from application to issue in 2025. Through 2019 the median was zero: at least half were issued the day they were filed.
- The median value owners declared on a deck-only permit doubled, from $10,000 in 2016 to $20,000 in 2025.
- June is the busiest month to apply. November and December are the quietest.
Seattle Deck Permits by Year
From 2011 to 2019 Seattle issued 263 to 340 deck permits a year. The count fell to 210 in 2020 and stayed near 200 from 2023 to 2025 (201, 184, 182). 2026 has already passed 2025: 183 permits by October 26, 2026, the most at this point of the year since 2022. Applications, the work that will be built next, are up 12% on 2025 at the same date (195 against 174).
| Year | Permits issued | Applications filed |
|---|---|---|
| 2026 so far | 183 | 195 |
| 2025 | 182 | 193 |
| 2024 | 184 | 197 |
| 2023 | 201 | 197 |
| 2022 | 249 | 260 |
| 2021 | 285 | 320 |
| 2020 | 210 | 232 |
| 2019 | 305 | 308 |
| 2018 | 308 | 324 |
| 2017 | 282 | 300 |
| 2016 | 299 | 305 |
| 2015 | 315 | 324 |
| 2014 | 340 | 355 |
| 2013 | 333 | 330 |
| 2012 | 263 | 271 |
| 2011 | 299 | 308 |
Where Seattle Builds Decks
Wallingford has the most deck permits of any Seattle neighborhood: 95 since 2016, ahead of North Admiral (Admiral) and Ravenna with 79 each. The map shades the City’s 94 neighborhoods by deck permits issued since 2016; on a computer, hover over a neighborhood to see its count, and every count is also in the table below. The darkest shades fall north of the Ship Canal, along Lake Washington and across West Seattle, with Queen Anne, Magnolia and Capitol Hill close behind. Downtown, South Lake Union, the industrial areas and the University District have few or none: they have few single-family houses.
Deck Permits in All 94 Seattle Neighborhoods
Neighborhoods use the City of Seattle’s Neighborhood Map Atlas, so a few carry the City’s name with the common one in parentheses. The typical declared value is the median for permits that cover only a deck, shown where a neighborhood has at least 8 of them. Names in links go to our page for that neighborhood, and “=” marks a rank shared by neighborhoods with the same count.
| Rank | Neighborhood | District | Permits since 2016 | 2026 so far | Typical declared value |
|---|---|---|---|---|---|
| 1 | Wallingford | North Central | 95 | 4 | $20,000 |
| =2 | North Admiral (Admiral) | West Seattle | 79 | 3 | $15,000 |
| =2 | Ravenna | Northeast | 79 | 4 | $11,444 |
| 4 | Seward Park | Seward Park | 70 | 3 | $17,841 |
| 5 | North Queen Anne | Queen Anne | 67 | 3 | $15,000 |
| =6 | Leschi | Central Area | 66 | 2 | $15,000 |
| =6 | North Beach/Blue Ridge | Northwest | 66 | 9 | $19,750 |
| 8 | Fauntleroy | West Seattle | 65 | 6 | $18,000 |
| 9 | Briarcliff | Magnolia | 64 | 3 | $14,436 |
| 10 | Matthews Beach | Lake City | 63 | 3 | $17,275 |
| 11 | Stevens | Capitol Hill | 62 | 3 | $19,000 |
| 12 | Gatewood (Morgan Junction) | West Seattle | 60 | 7 | $14,250 |
| 13 | Mount Baker | Rainier Valley | 59 | 3 | $10,000 |
| 14 | Broadview | Northwest | 57 | 5 | $20,000 |
| 15 | Phinney Ridge | North Central | 56 | 4 | $9,300 |
| 16 | Loyal Heights | Ballard | 55 | 2 | $12,000 |
| 17 | Green Lake | North Central | 53 | 8 | $18,498 |
| =18 | Greenwood | Northwest | 52 | 5 | $7,900 |
| =18 | Southeast Magnolia | Magnolia | 52 | 1 | $11,809 |
| =18 | Sunset Hill | Ballard | 52 | 2 | $15,000 |
| 21 | Wedgwood | Northeast | 51 | 1 | $18,627 |
| 22 | Laurelhurst | Northeast | 50 | 1 | $22,000 |
| 23 | East Queen Anne | Queen Anne | 49 | 6 | $12,000 |
| 24 | Lawton Park | Magnolia | 47 | 3 | $12,100 |
| =25 | Madrona | Central Area | 45 | 0 | $13,771 |
| =25 | West Queen Anne | Queen Anne | 45 | 1 | $11,414 |
| =27 | Columbia City | Rainier Valley | 44 | 5 | $12,500 |
| =27 | Mid-Beacon Hill | Beacon Hill | 44 | 7 | $16,300 |
| =29 | Alki | West Seattle | 40 | 3 | $20,400 |
| =29 | Maple Leaf | Northgate | 40 | 3 | $20,000 |
| 31 | Windermere | Northeast | 37 | 3 | $20,000 |
| 32 | View Ridge | Northeast | 36 | 3 | $20,000 |
| =33 | Genesee | West Seattle | 35 | 2 | $11,922 |
| =33 | Seaview | West Seattle | 35 | 5 | $15,000 |
| =35 | Arbor Heights | West Seattle | 33 | 5 | $12,260 |
| =35 | Rainier Beach | Rainier Valley | 33 | 1 | $13,823 |
| =35 | West Woodland | Ballard | 33 | 3 | $14,500 |
| =38 | Bryant | Northeast | 32 | 2 | $8,391 |
| =38 | Fairmount Park | West Seattle | 32 | 3 | $10,908 |
| =38 | North Beacon Hill | Beacon Hill | 32 | 1 | $9,000 |
| =38 | Roosevelt | Northeast | 32 | 2 | $15,000 |
| =42 | Crown Hill | Northwest | 28 | 0 | $10,370 |
| =42 | Harrison/Denny-Blaine | Central Area | 28 | 2 | $18,500 |
| =44 | Montlake | Capitol Hill | 27 | 5 | $9,000 |
| =44 | Whittier Heights | Ballard | 27 | 0 | $8,250 |
| =46 | Cedar Park | Lake City | 25 | 1 | $17,697 |
| =46 | High Point | Delridge | 25 | 5 | $41,788 |
| 48 | Fremont | North Central | 24 | 3 | $13,000 |
| =49 | Haller Lake | Northgate | 23 | 1 | $10,000 |
| =49 | Highland Park | Delridge | 23 | 1 | $20,000 |
| 51 | Minor (Squire Park) | Central Area | 22 | 2 | $14,402 |
| 52 | Victory Heights | Lake City | 21 | 2 | $21,494 |
| =53 | Ballard | Ballard | 19 | 3 | $14,500 |
| =53 | Madison Park (Washington Park) | Capitol Hill | 19 | 1 | $50,000 |
| =55 | Atlantic (Judkins Park) | Central Area | 17 | 0 | $8,000 |
| =55 | Dunlap | Rainier Valley | 17 | 1 | $10,638 |
| =55 | Meadowbrook | Lake City | 17 | 0 | $16,000 |
| 58 | Olympic Hills | Lake City | 16 | 0 | $15,590 |
| =59 | Brighton | Rainier Valley | 15 | 1 | $15,000 |
| =59 | Broadway | Capitol Hill | 15 | 0 | $21,500 |
| =59 | Licton Springs | Northgate | 15 | 2 | $11,200 |
| =59 | Riverview | Delridge | 15 | 1 | $15,000 |
| 63 | Mann | Central Area | 13 | 2 | $20,000 |
| =64 | Bitter Lake | Northwest | 12 | 0 | — |
| =64 | North Delridge | Delridge | 12 | 1 | $7,240 |
| =64 | Roxhill | Delridge | 12 | 1 | — |
| =64 | South Beacon Hill | Beacon Hill | 12 | 1 | $15,000 |
| =68 | Rainier View | Rainier Valley | 11 | 2 | — |
| =68 | South Delridge | Delridge | 11 | 1 | — |
| =68 | University Heights | University District | 11 | 1 | — |
| 71 | Pinehurst | Northgate | 10 | 0 | $20,000 |
| 72 | Portage Bay | Capitol Hill | 9 | 0 | $10,600 |
| 73 | Lower Queen Anne | Queen Anne | 8 | 0 | — |
| =74 | South Park | Greater Duwamish | 5 | 2 | — |
| =74 | University District | University District | 5 | 0 | — |
| 76 | Eastlake | Cascade | 4 | 0 | — |
| 77 | Georgetown | Greater Duwamish | 3 | 0 | — |
| 78 | Interbay | Interbay | 2 | 0 | — |
| 79 | Holly Park | Beacon Hill | 1 | 0 | — |
| =80 | Belltown | Downtown | 0 | 0 | — |
| =80 | Central Business District | Downtown | 0 | 0 | — |
| =80 | Denny Triangle | Downtown | 0 | 0 | — |
| =80 | First Hill | Downtown | 0 | 0 | — |
| =80 | Harbor Island | Greater Duwamish | 0 | 0 | — |
| =80 | Industrial District | Greater Duwamish | 0 | 0 | — |
| =80 | International District | Downtown | 0 | 0 | — |
| =80 | Pike-Market | Downtown | 0 | 0 | — |
| =80 | Pioneer Square | Downtown | 0 | 0 | — |
| =80 | SODO | Greater Duwamish | 0 | 0 | — |
| =80 | Sand Point | Northeast | 0 | 0 | — |
| =80 | South Lake Union | Cascade | 0 | 0 | — |
| =80 | University of Washington | University District | 0 | 0 | — |
| =80 | Westlake | Cascade | 0 | 0 | — |
| =80 | Yesler Terrace | Downtown | 0 | 0 | — |
Deck Permits by District
The City groups its neighborhoods into 20 districts. West Seattle leads with 379 deck permits since 2016, then Northeast (317) and North Central (228). The typical wait is the median number of days from application to issue for deck-only permits since 2016.
| District | Permits since 2016 | 2023–2025 | 2026 so far | Typical declared value | Typical wait |
|---|---|---|---|---|---|
| West Seattle | 379 | 95 | 34 | $15,000 | 21 days |
| Northeast | 317 | 62 | 16 | $17,000 | 12 days |
| North Central | 228 | 41 | 19 | $15,000 | 2 days |
| Northwest | 215 | 47 | 19 | $15,694 | 8 days |
| Central Area (Central District) | 191 | 33 | 8 | $14,000 | 28 days |
| Ballard | 186 | 41 | 10 | $12,250 | 1 days |
| Rainier Valley | 179 | 39 | 13 | $11,296 | 4 days |
| Queen Anne | 169 | 33 | 10 | $12,539 | 24 days |
| Magnolia | 163 | 30 | 7 | $12,250 | 11 days |
| Lake City | 142 | 32 | 6 | $17,275 | 39 days |
| Capitol Hill | 132 | 21 | 9 | $20,000 | 12 days |
| Delridge | 98 | 29 | 10 | $15,000 | 27 days |
| Beacon Hill | 89 | 21 | 9 | $12,272 | 2 days |
| Northgate | 88 | 17 | 6 | $13,000 | 2 days |
| Seward Park | 70 | 17 | 3 | $17,841 | 22 days |
| University District | 16 | 4 | 1 | $6,433 | 1 days |
| Greater Duwamish | 8 | 2 | 2 | — | — |
| Cascade | 4 | 0 | 0 | — | — |
| Interbay | 2 | 1 | 0 | — | — |
| Downtown | 0 | 0 | 0 | — | — |
How Long a Deck Permit Takes in Seattle
For a permit that covers only the deck, the median wait from application to issue was zero days from 2016 to 2019: at least half were issued the day they were filed. It rose to 7 days in 2020 and was 35 to 42 days from 2022 to 2025. In 2025, 30% were issued within a week and 35% took more than 60 days. 2026 so far shows a median of 26 days, but it only counts permits already issued, so the slower ones still in review can push it up.
What decides the path, the plans and the steps is in our Seattle deck permit guide, and the railing rules a permitted deck has to meet are in the deck railing code guide.
| Year issued | Median wait | Issued within a week | Took over 60 days | Permits |
|---|---|---|---|---|
| 2026 so far | 26 days | 36% | 24% | 150 |
| 2025 | 37 days | 30% | 35% | 141 |
| 2024 | 38 days | 27% | 33% | 135 |
| 2023 | 42 days | 30% | 42% | 149 |
| 2022 | 35 days | 31% | 38% | 172 |
| 2021 | 6 days | 50% | 33% | 216 |
| 2020 | 7 days | 51% | 21% | 135 |
| 2019 | 0 days | 58% | 26% | 185 |
| 2018 | 0 days | 70% | 19% | 166 |
| 2017 | 0 days | 75% | 13% | 183 |
| 2016 | 0 days | 66% | 13% | 196 |
What Seattle Owners Declare a Deck Is Worth
Every permit application states the value of the work. For permits that cover only a deck, the median declared value was $10,000 in 2016 and $20,000 in 2025; the middle half of 2025 permits fell between $10,000 and $38,346. This is the figure written on the application, not a final price, and permitted decks lean toward the bigger and higher ones: a low deck often needs no permit at all.
Prices per square foot, railing and stairs are in our Seattle deck cost guide.
| Year issued | Median declared value | Middle half of permits | Permits |
|---|---|---|---|
| 2026 so far | $20,000 | $10,000 to $46,925 | 150 |
| 2025 | $20,000 | $10,000 to $38,346 | 141 |
| 2024 | $20,000 | $10,000 to $47,800 | 135 |
| 2023 | $18,800 | $9,821 to $35,500 | 149 |
| 2022 | $15,000 | $8,352 to $30,776 | 172 |
| 2021 | $15,000 | $8,000 to $34,549 | 216 |
| 2020 | $15,000 | $8,000 to $27,063 | 133 |
| 2019 | $13,000 | $5,717 to $22,000 | 183 |
| 2018 | $10,337 | $6,194 to $20,000 | 165 |
| 2017 | $10,000 | $5,700 to $20,000 | 183 |
| 2016 | $10,000 | $5,472 to $22,000 | 195 |
When Seattle Homeowners Apply for Deck Permits
Across 2016 to 2025, June had the most deck permit applications (287) and November and December the fewest (158 and 155). With a median wait above a month from 2022 to 2025, applying in winter or early spring leaves time to build in the dry months.
What Kind of Deck Work Gets a Permit
Of the 2,688 deck permits issued since 2016:
- 68% cover the deck alone; the rest come with other work on the house, such as an addition or a remodel.
- 26% replace, rebuild or repair an existing deck.
- 6% add a cover, a roof or a pergola over a deck.
- 4% are rooftop or roof decks.
- 3% are decks built as part of a new house.
How We Counted
- Source: the City of Seattle Building Permits dataset from the Seattle Department of Construction and Inspections (SDCI), downloaded on October 29, 2026, with applications through October 26, 2026.
- A deck permit here is a single-family or duplex building permit, for an addition, an alteration or a new house, whose work description names a deck. Roof sheathing called “roof decking” and parking decks are left out.
- One batch of 140 identical permits filed in June 2016 in ZIP 98108 (gutters, windows and exterior decking replaced on a group of houses) is left out so that one program does not count as 140 decks.
- Each permit is placed on the City’s Neighborhood Map Atlas by its coordinates. 12 permits since 2016 have no usable location and count only in the citywide totals.
- “Deck-only” permits are the ones whose description is about the deck alone, with no addition, remodel, garage or other house work. Wait times and declared values use only these.
- Declared value is the project value the applicant gave the City. Wait time is the issue date minus the application date.
- Years go by the date a permit was issued. 2026 is partial, through October 26, 2026.
Using these numbers: credit "Deck Builder Seattle analysis of City of Seattle SDCI permit data" and link to this page. We update it as the City publishes new permits.
Download the data: all 94 neighborhoods (CSV) · by year (CSV) · the map (SVG).
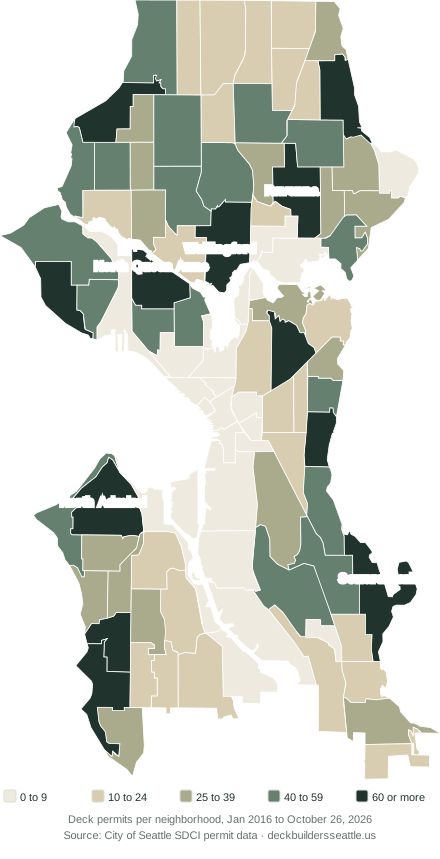
Embed the map on your site with this code:
<a href="https://deckbuildersseattle.us/blog/seattle-deck-permits-by-neighborhood/"><img src="https://deckbuildersseattle.us/wp-content/uploads/deck-data-2026-10/seattle-deck-permits-map.svg" alt="Map of Seattle deck permits by neighborhood, 2016 to 2026" width="440" height="859"></a>
<p>Source: <a href="https://deckbuildersseattle.us/blog/seattle-deck-permits-by-neighborhood/">Deck Builder Seattle analysis of City of Seattle SDCI permit data</a></p>
Seattle Deck Permit Data: Common Questions
How many deck permits does Seattle issue a year?
About 182 to 201 a year lately: 201 in 2023, 184 in 2024 and 182 in 2025, counting permits for decks on houses. 2026 reached 183 by October 26, 2026. From 2011 to 2019 the City issued 263 to 340 a year.
How long does it take to get a deck permit in Seattle?
For a permit that covers only the deck, the median was 37 days from application to issue in 2025, and 30% were issued within a week. Through 2019 at least half were issued the day they were filed.
Which Seattle neighborhood builds the most decks?
Wallingford, with 95 deck permits from January 2016 to October 26, 2026. By district, West Seattle leads with 379.
How much do Seattle homeowners spend on a permitted deck?
Owners declared a median of $20,000 on permits for a deck alone in 2025, and half of them fell between $10,000 and $38,346. That is the value on the application, not a final price.
When do most Seattle homeowners apply for deck permits?
In June. From 2016 to 2025, June had 287 deck permit applications, against 158 in November and 155 in December.
Planning a Deck in Seattle?
Call our Seattle deck builders with your address and the deck you have in mind, and send photos if you have them. At the free on-site estimate we measure, tell you whether the deck needs a Seattle permit and give you a written price before any work starts. Up to 25% off your deck project. Free on-site estimate, no obligation.